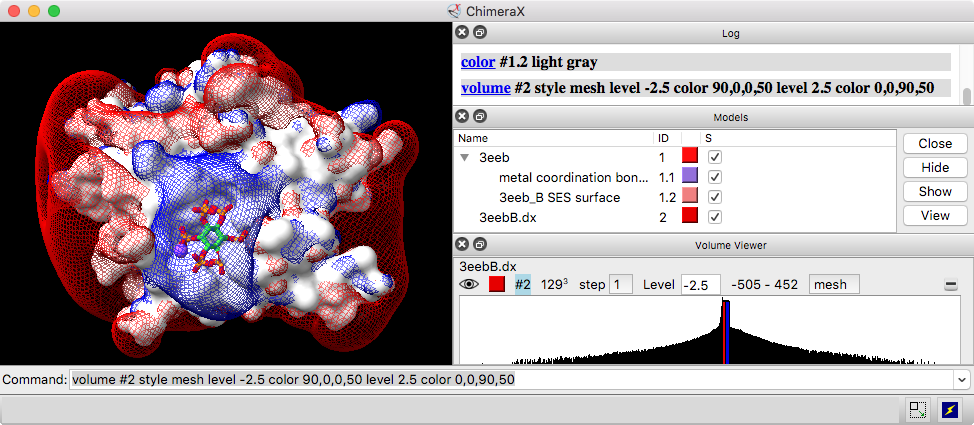
Volume data is a broad term for density maps, electrostatic potential maps, 3D imaging data, and other data sets with numerical values associated with points on a 3D grid. Volume data can be multichannel and/or time series. Volume data can be opened with the command open (which automatically starts Volume Viewer) and saved to a file with save.
 |
Volume Viewer is a graphical interface for adjusting contour levels and other aspects of volume data display. Alternatively, these settings and more can be adjusted with the volume command.
See also: Toolbar, Map Coordinates, Fit in Map, Segment Map, Fit to Segments, Map Eraser, Map Filter, Measure and Color Blobs, Measure Volume and Area, Map Statistics, Marker Placement, Color Zone, Surface Zone, Hide Dust, show, color, transparency, topography, vseries, molmap, surface operations, volume operations, measurements, ChimeraX DICOM Reference
Even without data, Volume Viewer can be started from the Volume Data section of the Tools menu. The Volume Viewer window can be manipulated like other panels in ChimeraX (more...).
By default, a data set will be displayed automatically if it does not exceed a certain size, and the initial display may be as an isosurface or as a single plane (details...). Many settings for newly opened data, including the size limits controlling these behaviors, can be customized with the volume defaultvalues command. The volume settings command reports current display settings and other volume model properties in the Log.
The initial contour level of an isosurface is set to enclose 1% of grid points, except for maps opened by EMDB fetch, which will be shown at the depositor-recommended contour level, if any. For single-plane display, the middle plane along Z is shown initially with a linear ramp in grayscale from the 10th (black) to 99th (white) percentile of values.
A histogram of values with moveable thresholds (contour levels) is shown for each data set. Above the histogram are:
The step setting controls subsampling; a value of 1 means all the data points are used to generate the display, while 2 means every other data point is taken along each axis, reducing the number of points used by a factor of eight. Step sizes can be different in the X, Y, and Z directions, although this can only be set with the volume command step option (not with the graphical interface).
The display region is not necessarily the full extent
of the data grid; it can be limited with the
volume command
region option or the
mouse mode for crop volume
![]() .
.
The thresholds on the Volume Viewer
histogram, each associated with a data Level,
control how data values are mapped to the display.
They can be added and deleted using the
context menu
and adjusted interactively by dragging in the histogram,
or by dragging in the graphics window with the
mouse mode for contour level
![]() or windowing
or windowing
![]() .
.
For the surface or mesh style:
Each threshold is shown on the histogram as a vertical bar that can be moved horizontally. Each threshold corresponds to a contour surface, generated as a submodel of the data model. For most types of volume data, an initial threshold is set so that 1% of voxels (1% of the data grid points) lie above it. For data types typically used for electrostatic potential (APBS, UHBD, DelPhi) or electron localization (Gaussian, gOpenMol), two initial thresholds are placed symmetrically about zero.
For the volume (image) style:
Each threshold is shown as a small square that can be moved horizontally and/or vertically. The thresholds and connecting lines on each histogram define a transfer function that maps data values to colors and intensities. For most types of volume data, three initial thresholds are set: zero intensity at the 10% rank value, 0.8 intensity at 99% rank, and full intensity at the largest value. DICOM data are initially shown with thresholds: (–1000,0),(300,0.9),(3000,1). For data types typically used for electrostatic potential (APBS, UHBD, DelPhi) or electron localization (Gaussian, gOpenMol), five initial thresholds are set: zero intensity at zero and two more on either side, ramping up to full intensities at the largest negative and largest positive values. The image representation is a submodel of the data model. Initial threshold positions for the image style can be restored by clicking the Medical Image icon.
The Volume Viewer context menu includes:
Histogram ranges and threshold levels are given in the same units as the data. The volume command also allows specifying threshold levels in units of root-mean-square deviations from zero or standard deviations from the mean.
When multiple maps are specified in a single open command (multiple files specified with wild cards or globbing), channel numbers are discerned from the filenames, if possible. Multiple channels can also be read from a single file (OME TIFF and certain other volume formats). Alternatively, multiple maps that are already open as independent data sets can be grouped into a single multichannel data set using the volume channels command, as long as the maps are the same size (have the same numbers of points in each dimension).
Channels of a single multichannel data set are synchronized, in that changing the display style, step size, crop boundaries, or display plane of one channel in the Volume Viewer interface or with the mouse changes it for all of the channels in the group. The volume command allows changing settings for individual channels.
Color blending of multichannel data in the image display style can be done on the GPU.
See also: the ChimeraX light microscopy highlight