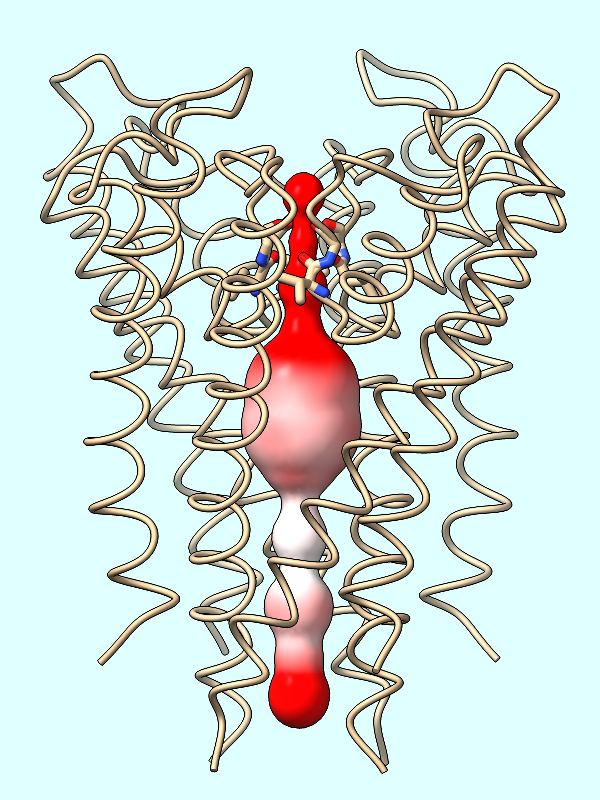
radius |

lipophilicity |

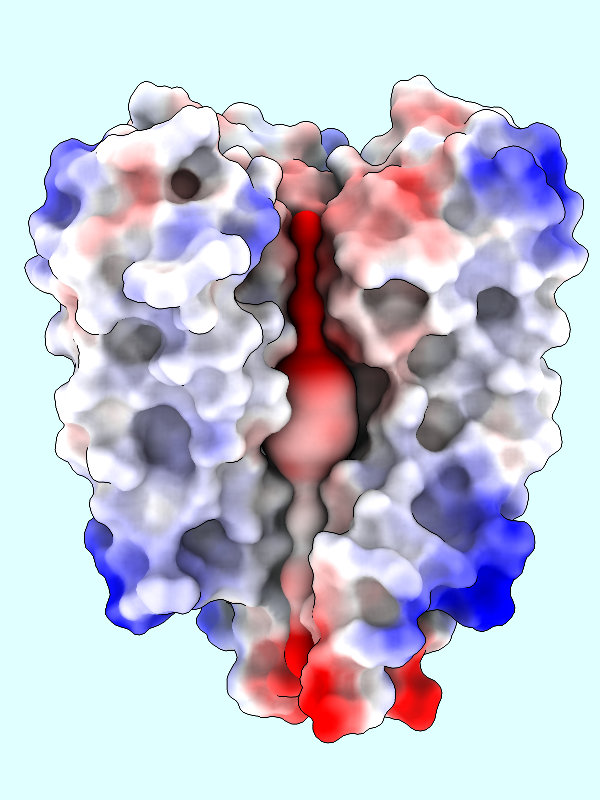
electrostatics |
last updated November 2022
This tutorial demonstrates how to color a channel computed by the MOLEonline Server to show various properties: channel radius, molecular lipophilic potential, and electrostatic potential. See also: MOLEonline feature highlight, ChimeraX recipe for CAVER display

radius
lipophilicity
electrostatics
This tutorial uses Protein Data Bank entry 1bl8, a structure of the potassium channel. The MOLEonline Server was run in “pore mode” on this structure (details... ) and results were downloaded in JSON format. Save the file molepore-1bl8.json to a convenient (findable) location on your computer.
Start ChimeraX version 1.5 or newer. If you want to use the click-to-execute links, view this page in the ChimeraX Browser, e.g. by entering the ChimeraX command:
Command: open https://www.rbvi.ucsf.edu/chimerax/data/mole-channel/mole-channel.html
Open the structure:
Command: open 1bl8
The Log reports that the structure contains protein chains A-D and potassium-ion “residues” named K. The protein is opened as model #1 and displayed as cartoons, with atomic detail only near the ions.
If you wish, review how to move structures (part of the Binding Sites tutorial). Feel free to rotate, translate, and zoom as you like throughout.
Hide the atoms and show the cartoons as thin tubes:
Command: hide #1
Command: cartoon style width .5 thick .5
Change the background color and show silhouette outlines. The depthJump parameter controls what change in depth triggers drawing an outline; smaller values give more outlines.
Command: set bgColor light cyan
Command: graphics sil true depth .01
If you wish, switch from perspective projection, in which farther-away objects appear smaller, to orthographic projection, in which they do not:
Command: camera ortho
Next, use the ChimeraX file browser to open the JSON file of MOLE results:
Command: open browse format mole
(locate and open the previously downloaded file, molepore-1bl8.json)
The file contains a single channel, opened in ChimeraX as a set of spheres. The protein structure is model #1, and the channel spheres are model #2. Select the narrowest parts of the channel (spheres with radius <2 Å), show protein residues near those parts, and then clear the selection:
Command: sel #2 & @@radius<2
Command: show protein & sel :<2.5
Command: size stickrad .4
Command: ~sel
This only displays atoms in the sidechains of the residues, which happen to be pointing away from the channel. By default, showing the cartoon (ribbon) for a residue suppresses the display of its backbone atoms, but you can turn off this suppression:
Command: cartoon suppressBackbone false
The backbone atoms of the displayed residues (Val 76 and Gly 77 in each chain) form the “selectivity filter” that favors the passage of K+ over Na+, Cl–, etc.
If you look closely at the channel model, you can see ridges between the different spheres. For a smoother appearance, show the model as a surface and hide the underlying spheres:
Command: surf #2
Command: hide #2

|
The spheres are essentially dummy atoms, and they have an attribute named radius. The channel surface can be colored by these attribute values:
Command: color byattribute radius #2 palette puor
Many palettes are available, including the ColorBrewer palette PuOr (orange → white → purple). Alternatively, a custom palette can be specified as a series of color names (details...).
Command: color byattribute radius #2 palette darkslateblue:red:yellow

|
The molecular lipophilic potential (MLP) is calculated from the atoms of a protein. In many cases, a structure is missing the coordinates of some atoms, which may affect the results. You can identify truncated residues with the template-mismatch specifier, for example:
Command: sel template-mismatch
Command: label sel height 2
The Log reported that 24 residues were selected, and you can see from the labels that they occur all over the structure.
Command: ~sel; label delete
In this case, whether the truncated residues are repaired makes little difference to the coloring of the channel surface by lipophilicity or electrostatics (below). However, if you do want to repair them, it can be done with the dockprep command, which also adds hydrogens. If you do not want to repair the sidechains, skip the next two commands:
Command: dockprep #1
Command: hide H
Color the surface of the channel (#2) by the protein's MLP:
Command: mlp protein surfaces #2
First generating the surface of the channel (Command: surf #2 as done in the setup) is crucial to coloring the channel by lipophilicity or electrostatic potential. The spheres themselves will not be colored.

|
The electrostatic potential (ESP) is calculated from the atoms of the protein. If not done already, you can optionally repair any truncated sidchains as described above.
Calculate the protein's ESP and color the channel surface (#2) by its values:
Command: coulombic protein surfaces #2 offset -1
The default palette for ESP coloring is red for negative, white neutral, and blue for positive. The predominance of red in the makes sense for a channel that is selective for positively charged K+ ions.
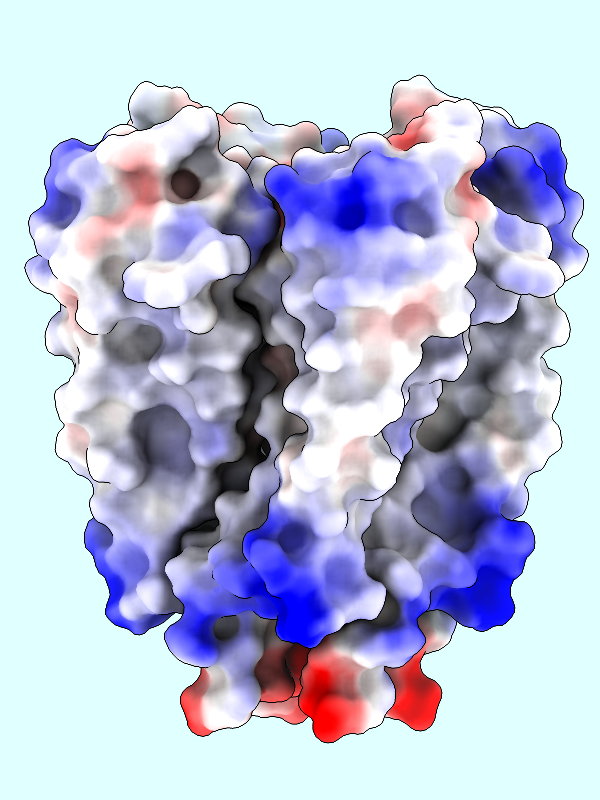
A negative offset was used to show the potential inside the channel surface. For the usual case of coloring a protein surface by its own potential, a positive offset (default 1.4 Å) is used to show the potential outside the surface, where interactions with other molecules would occur. The protein surface shows a full range of positive to negative values:

|

|
Command: coulombic protein
Use a lighting preset with ambient occlusion to better show the shape of the surface:
Command: light soft
Lighting from multiple directions (default 64, maximum 1024) is used to approximate ambient occlusion. A higher number of directions gives smoother gradations in shading, but may slow rendering on larger systems:
Command: light multi 256
You can hide one of the protein chains to see the channel surface inside:
Command: hide /A targ acs
This tutorial includes the JSON file of MOLE results (molepore-1bl8.json), so you do not need to do the following unless you want to generate such a file yourself.