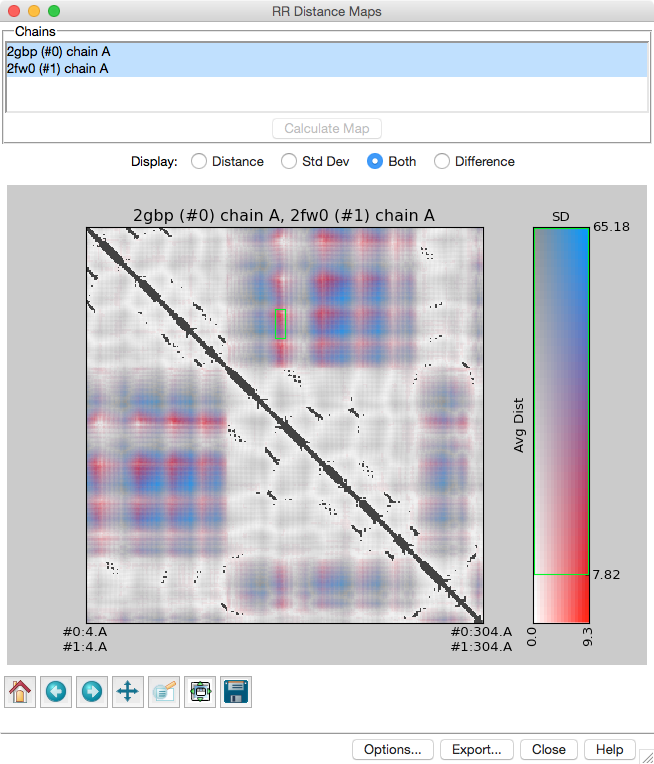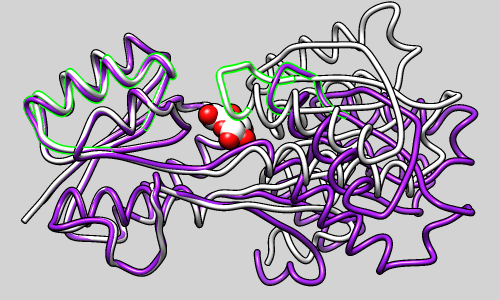

RR Distance Maps creates a distance map, a generalization of a protein contact map in which residue-residue distances are shown with color gradations. In a protein contact map, a pair of residues is simply marked as contacting or not contacting based on some criterion such as a cutoff distance. RR Distance Maps generates a color-coded map of the Cα-Cα distances within an individual protein chain or a combined map for two or more related chains. In a combined map, the average (intrachain) distances and/or their standard deviations can be shown. Both quantities can be shown on the same map with different dimensions of color. For two chains, a map of the distance differences can also be shown. See also: Ramachandran Plot, Find Clashes/Contacts, Morph Conformations, distance, and
RRDistMaps: a UCSF Chimera tool for viewing and comparing protein distance maps. Chen JE, Huang CC, Ferrin TE. Bioinformatics. 2015 May 1;31(9):1484-6.
There are several ways to start RR Distance Maps, a tool in the Structure Comparison category.
Individual chains or blocks of chains can be chosen from the Chains list with the left mouse button. Ctrl-click toggles the status of an individual chain. Only protein chains containing α-carbons will be handled. If a single chain is chosen, an individual distance map will be generated. If multiple chains are chosen, they must have sequences similar enough to be aligned. The sequences will be aligned to obtain residue equivalences, and distance differences (if two chains), means, and standard deviations will be calculated for equivalenced residue pairs.
Clicking Calculate Map aligns the sequences (if multiple chains) and creates the map. The sequence alignment is shown in a Multalign Viewer window.
Choices for map Display:
Clicking Export brings up a dialog for saving the matrix data (distances, and if multiple chains, standard deviations, and if two chains, differences) to a text file as tab-separated or comma-separated values. Close exits from RR Distance Maps, and Help opens this manual page in a browser window.
When the distance map window has mouse focus:
If the map window becomes obscured by other windows, it can be resurrected with the Raise option for the RR Distance Maps instance in the Tools menu.
Several standard navigation icons below the plot are provided by matplotlib. If a mouse mode such as zooming is activated by clicking one of these icons, it is necessary to click the icon again to turn the mode off.
Clicking Options... opens the Colormap Options:
Clicking Apply updates the map display; it also removes any masking, but subsequently the green rectangle can be resized smaller again to resume masking. Reset restores the default settings in the dialog, and Cancel simply dismisses the dialog.
Note: a simple binary contact-map-like appearance can be obtained by masking low (contact) distances after setting the excluded color to black and all other colors to white, or using some other similar dark-light scheme.
Sequence alignments. Pairwise alignments are calculated with the Needleman-Wunsch algorithm. Multiple alignments are calculated with a MUSCLE web service, with settings as described for Align Chain Sequences.
Combined (multiple-chain) maps only include residues from fully populated alignment columns. Only sequence alignment columns containing residues from all chosen chains are used to define the residue equivalences in a combined map.
Coloring is applied across the full value range. Although high and/or low values can be masked, colors can only be specified for the minimum and maximum values in the entire map. It might be useful to specify colors for the minimum and maximum values of a narrower range of interest to emphasize variations within that range.
Combined (multiple-chain) maps omit terminal residues. Related to the preceding point, the N-terminal two positions and C-terminal two positions are omitted from a combined map, because it was found that large standard deviations arising from these positions made it difficult to see variations on a smaller, more generally useful scale.