
 about
projects
people
publications
resources
resources
visit us
visit us
search
search

Some notable milestones in CGL/RBVI's long history include:
- 1965: MIT Project MAC system used to display first interactive molecular structures by Cyrus Levinthal and Robert Langridge
- 1969: Langridge establishes the Computer Graphics Laboratory (CGL) at Princeton University
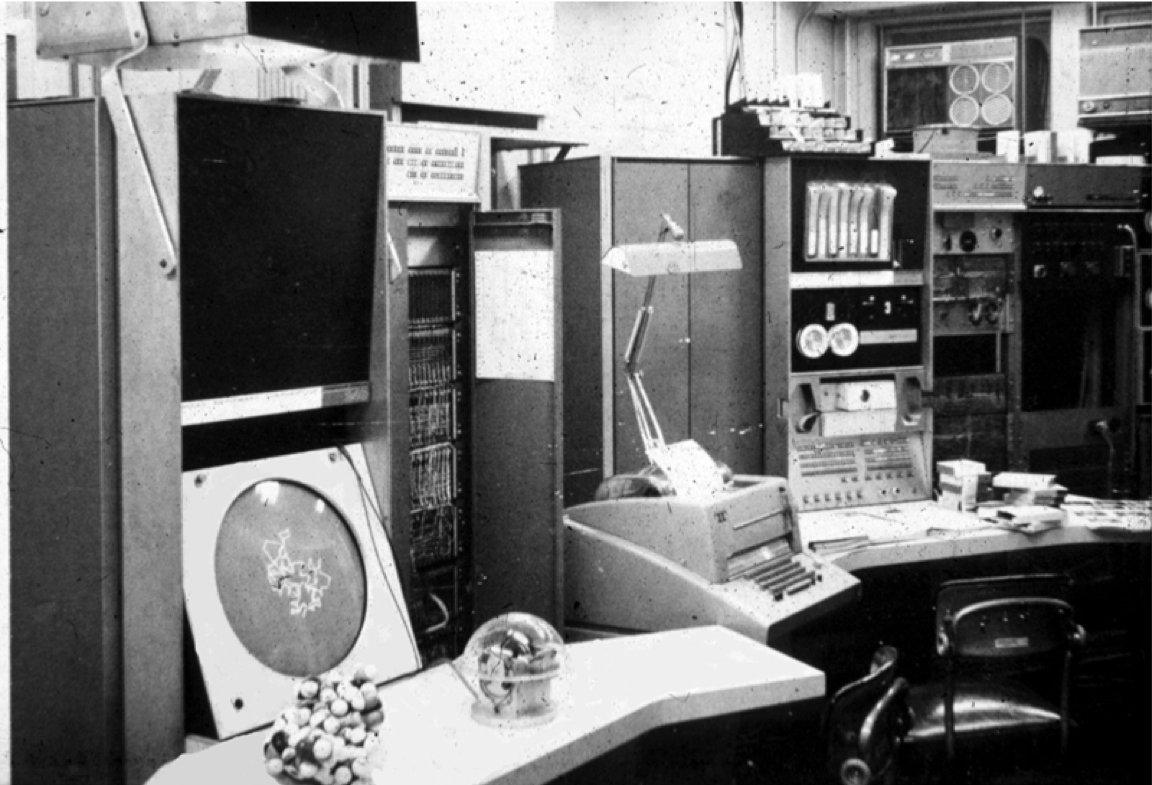
- 1971: CGL acquires an Evans & Sutherland (E&S) LDS-1 interactive graphics display and a Digital Equipment Corp. (DEC) PDP-10 mainframe computer to drive the display
- 1974: Langridge develops Computer Aided Analysis of Protein Structure (CAAPS) software
- 1976: CGL moves from Princeton to UCSF
- 1976: CGL acquires an E&S Picture System 2 graphics system and DEC PDP-11/70 computer for ~$500,000
- 1978: Molecular Interactive Display System (MIDS) software package for UNIX developed at the CGL by Tom Ferrin, Conrad Huang and Martin Pensak
- 1979: Serial #1 E&S Color Display added to CGL's PS/2
- 1981: First interactive color molecular graphics research studies reported in Science by Langridge, Ferrin, Kuntz and Connolly
- 1985: Annual CGL Holiday Card tradition established
- 1988: CGL's Molecular Interactive Display and Simulation (MIDAS) software first released
- 1993: Ferrin becomes PI of CGL's "P41" NIH grant
- 1994: Langridge retires, CGL web site created (first web site at UCSF)
- 1995: Development begins on UCSF Chimera
- 2000: CGL renamed to Resource for Biocomputing, Visualization and Informatics (RBVI)
- 2002: UCSF Chimera first released
- 2003: RBVI moves to UCSF Mission Bay Campus
- 2004: UCSF Chimera published in J. Computational Chemistry
- 2005: RBVI's Viz Vault goes live
- 2007: Support for CryoEM density maps added to Chimera
- 2013: Support for 4D light sheet microscopy data sets added to Chimera
- 2016: Number of journal articles citing UCSF Chimera surpasses 10,000 and downloads surpass 500,000
- 2017: First "alpha" release of UCSF ChimeraX
- 2018: Virtual Reality (VR) headset support added to ChimeraX
- 2020: ChimeraX 1.0 released
And here are some of the videos from our collection of historical film clips:

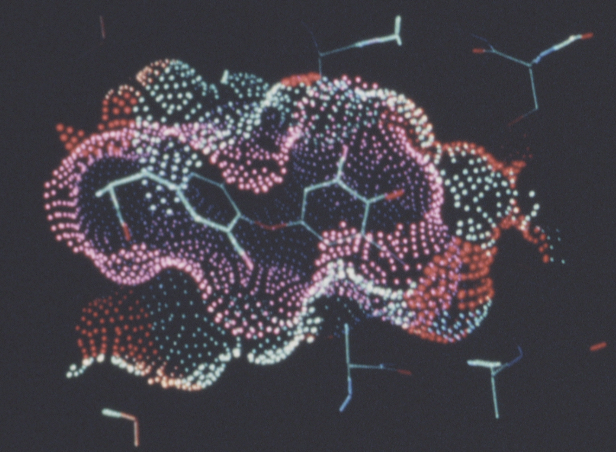
Interactive Molecular Graphics, Thomas Ferrin and Robert Langridge (UCSF), 1980. Includes van der waals dot surfaces using UCSF BILD, molecular interactions and docking using UCSF MIDS, and a color wheel illustrating capabilites of our new Evans & Sutherland "shadow mask" color calligraphic monitor.
InteractiveMolGraph.mp4 (13:39 minutes -- no audio)

A Brief History of Molecular Graphics, Anne Feibelman, circa 1985. Includes opening animation (i.e., not interactive graphics) illustrating DNA super-helical structure by Nelson Max (LLNL), interviews with Linus Pauling and Robert Language, film from MIT's Project MAC including the first application of interactive molecular graphics, film from Evans & Sutherland LDS-1 graphics system at Princeton University, and interactive docking of a protein with DNA using UCSF MIDAS.
MolGraphics-Feibelman.mp4 (10:41 minutes)

Interview with Langridge by Russ Altman, Stanford, 2002. Bob talks about the earliest days of realtime molecular graphics, including Project MAC in 1964, along with some of the advantages that interactive computer models have over traditional hand-held molecular models.
Langridge-Altman.mp4 (38:34 minutes)
For additional animations created with UCSF Chimera and ChimeraX, see Molecular Animations.
About RBVI | Projects | People | Publications | Resources | Visit Us
Copyright 2018 Regents of the University of California. All rights reserved.